| Mainboard Stock |
 |
| TPEx Market Chart |
|

| TPEx Index: 262.64
|
▲3.25 |
High: 263.01 |
Low: 259.93 |
| Total Trading Value (NTD, in 100 million): 1159.66 |
| Total Trading Volume_(Shares, in thousand): 847,365 |
| Total No. of Transactions: 737,902 |
|
|
| Industrial Sub-Indices |
|
| Category |
Open |
High |
Low |
Close |
Change |
| Textile | 124.22 |
125.25 | 123.98 |
125.25 |
▲1.03 |
| Electric Machinery | 184.63 |
185.85 | 184.63 |
185.43 |
▲0.98 |
| Iron and Steel | 136.48 |
137.9 | 136.19 |
137.73 |
▲1.31 |
| Building Material and Construction | 204.62 |
206.01 | 204.26 |
205.69 |
▲1.06 |
| Shipping and Transportation | 178.83 |
179.14 | 178.27 |
178.91 |
▲0.33 |
| Tourism and Hospitality | 80.03 |
80.32 | 79.91 |
80.23 |
▲0.20 |
| Other | 172.65 |
173.81 | 172.09 |
172.48 |
▲0.85 |
| Chemical | 180.22 |
184.14 | 179.51 |
184.14 |
▲4.14 |
| Biotechnology and Medical Care | 149.16 |
149.94 | 149.12 |
149.24 |
▲0.16 |
| Semiconductor | 131.56 |
134.33 | 131.56 |
133.2 |
▲1.79 |
| Computer and Peripheral Equipment | 134.96 |
136.61 | 134.53 |
136.05 |
▲1.97 |
| Optoelectronic | 58.88 |
60.08 | 58.88 |
60.08 |
▲1.29 |
| Communications and Internet | 169.21 |
173.49 | 169.21 |
171.04 |
▲2.49 |
| Electronic Parts and Components | 177.95 |
180.65 | 177.95 |
179.66 |
▲2.68 |
| Electronic Products Distribution | 103.72 |
104.56 | 102.46 |
102.67 |
▼0.22 |
| Information Service | 186.6 |
187.8 | 186.6 |
187.71 |
▲1.24 |
| Other Electronic Industries | 322.05 |
331.42 | 322.05 |
331.42 |
▲9.82 |
| Cultural and Creative Industries | 234.48 |
236.88 | 234.48 |
236.04 |
▲1.59 |
| Green Energy and Enviromental Services | 110.12 |
110.59 | 108.28 |
108.39 |
▼1.72 |
| Digital and Cloud Services Industry | 88.58 |
89.7 | 88.58 |
89.66 |
▲1.20 |
| Household Industry | 84.68 |
84.86 | 84.55 |
84.57 |
▼0.11 |
| TPEx 50 Index | 310.58 |
315.85 | 310.58 |
315.29 |
▲5.58 |
| TPEx Taiwan Treasury Benchmark Index | 1050.96 |
1050.96 | 1050.19 |
1050.19 |
▼0.74 |
|
|
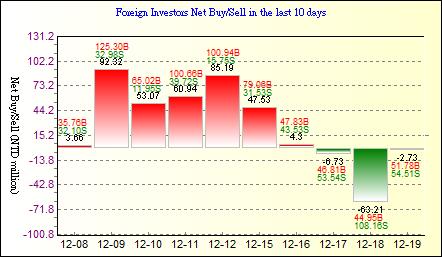
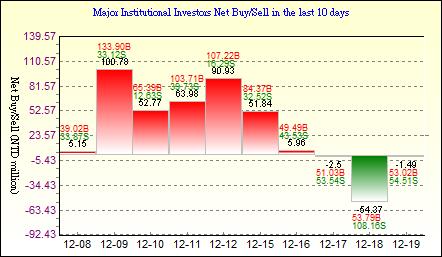
| Foreign & Institutional Investors Trading & Margin Purchases and Short Sales |
| |
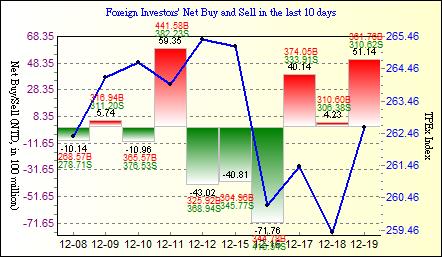
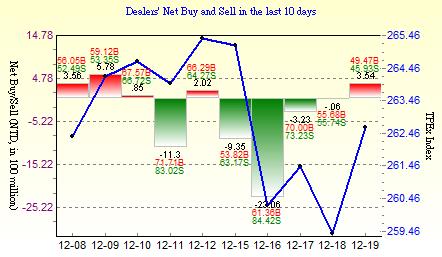
Foreign & Institutional Investors Trading
2025-12-19 (Unit:NTD 100million)
| Purchase Amt. | Sale Amt. | Net Change |
| Foreign Investors including Mainland Area Investors | 361.76 |
310.62 | 51.14 |
| Securities Investment Trust Companies | 42.19 |
30.17 | 12.02 |
| Dealers | 49.47 |
45.93 | 3.54 |
| Total | 453.42 |
386.72 | 66.70 |
| |
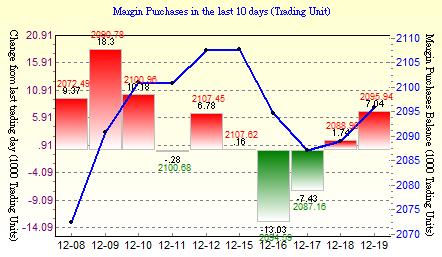
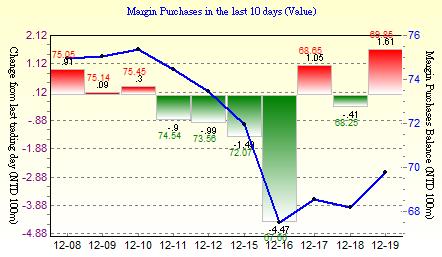
Margin Purchases and Short Sales
2025-12-19
| Item | Margin Buy |
Margin Sale | Cash Redemption | Current Margin |
Change |
| Margin Purchases (Shares, in thousand) |
67.26 |
59.19 |
1.04 |
2095.94 |
7.04 |
| Margin Purchases (NTD, in 100 million) |
51.38 |
47.23 |
0.67 |
1119.10 |
3.49 |
| Item | Short Sell |
Short Cover | Stock Redemption | Current Short Balance |
Change |
| Short Sales_(Shares, in thousand) |
5.49 |
3.22 |
0.66 |
69.85 |
1.61 |
|
| |
| |
| Foreign & Institutional Investors Trading |
|
|
 |
 |
 Net Buy/Sell(NTD 100m
B:Total Purchased S:Total Sold) Net Buy/Sell(NTD 100m
B:Total Purchased S:Total Sold)
 TPEx Index TPEx Index |
Net Buy/Sell(NTD 100m
B:Total Purchased S:Total Sold)
TPEx Index |
| |
 |
 |
| Net Buy/Sell(NTD 100m
B:Total Purchased S:Total Sold)
TPEx Index |
Net Buy/Sell(NTD 100m
B:Total Purchased S:Total Sold)
TPEx Index |
|
| |
| |
| Margin Balance |
|
| |
 |
 |
| Change from last trading day (1000 Trading Units)
Margin Purchases Balance |
Change from last trading day (NTD 100m)
Margin Purchases Balance |
| |
 |
| Change from last trading day (1000 Trading Units)
Short Sales Balance |
| |
| |
| Emerging Stock |
| |
| Emerging Stock Board Summary |
|
Trading Summary for Major Institutional Investors |
|
Emerging Stock Board Summary
2025-12-19
| Number of Registered ESB Companies: 354 |
| Total Trading Value (NTD, in 100 million): 31.31 |
| Total Trading Volume (Shares, in thousand): 35,130 |
| Total No. of Transactions: 30,683 |
|
|
ESB Major Institutional
2025-12-19 (Unit:NTD million)
| Total Purchased | Total Sold | Net Change |
| Foreign Investors | 51.78 |
54.51 | -2.73 |
| Securities Investment Trust Companies | 0 |
0 | 0 |
| Dealer | 1.24 |
0 | 1.24 |
| Total | 53.02 |
54.51 | -1.49 |
| |
| |
| |
| ESB Trading Information for Major Institutional |
|
|
 |
 |
| Net Buy/Sell(NTD 100m
B:Total Purchased S:Total Sold) |
Net Buy/Sell(NTD 100m
B:Total Purchased S:Total Sold) |
| |
 |
|
| Net Buy/Sell(NTD 100m
B:Total Purchased S:Total Sold) |
|
|
| |
| |
| Bond Information |
| |
| |
 |
 |
 Face Value of EBTS Outright Trading Face Value of EBTS Outright Trading
 Outstanding Amount of EBTS Repo& R-Repo 10Yr. Yield Outstanding Amount of EBTS Repo& R-Repo 10Yr. Yield |
Outstanding Amount of EBTS Repo& R-Repo
|
| |
 |
| Return Rate |
| |
| |
|